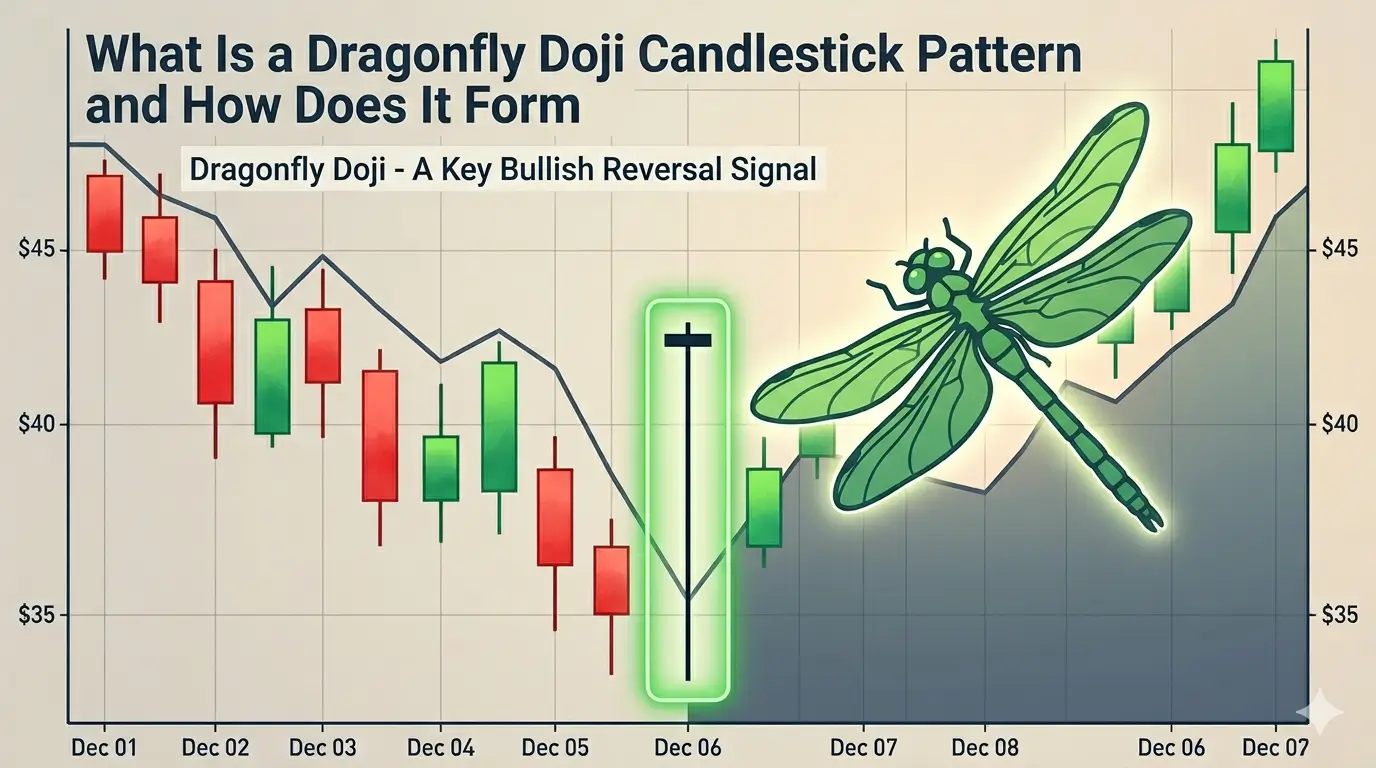
What Is a Dragonfly Doji Candlestick Pattern and How Does It Form
Discover what a Dragonfly Doji candlestick pattern is and how it forms. Learn whether the Dragonfly Doji is bullish or bearish, how it differs from the Gravestone Doji, and see real examples in uptrends and downtrends. This guide covers trading strategies, confirmation tips, and common mistakes.
Table of Contents
- Is Dragonfly Doji Candlestick Bullish or Bearish?
- What to Look for in a Dragonfly Doji
- Dragonfly Doji vs Gravestone Doji: Key Differences Explained
- Dragonfly Doji Candlestick Pattern Example in Real Charts
- Bullish Dragonfly Doji Candlestick Pattern at the Bottom of a Downtrend
- How to Trade the Dragonfly Doji: Strategies, Confirmation & Risk Management
- Limitations When Trading Dragonfly Doji Patterns
- Common Mistakes When Trading a Dragonfly Doji
- Best Indicators to Combine with Dragonfly Doji for Higher Accuracy
- Personal experience: experimental trade leveraging dragonfly doji pattern
- Conclusion
- Frequently Asked Question
The dragonfly doji is a specific type of doji (or doji candlestick pattern) that appears on a chart and can indicate a potential reversal in the market direction.
This pattern occurs after a significant pullback (intraday drop and recovery). The open and close prices are nearly the same while the open price is near the high of the day. The long lower shadow indicates there was a strong move in one direction before reversing. This "dragonfly" shape comes from a doji body that is almost the same as the price range of the day.
When interpreting this pattern, traders should consider the overall market trend and combine it with other technical analysis tools for confirmation.
There are certain conditions that need to be met first before a dragonfly doji can form. For example, the previous day's close must be different from today's open because if the close equals the open, then the previous day was a flat day and nothing happened that day.
Is Dragonfly Doji Candlestick Bullish or Bearish?
The dragonfly doji is primarily a bullish reversal signal, most commonly appearing at the top of a downtrend. It forms when sellers push prices lower during the session but buyers step in and push the price back up near the open — leaving a long lower shadow and an open and close that are nearly identical near the high of the session.
When the current bar closes near the high after a session low, this indicates that the bears were pushed back. This suggests that the downtrend may be losing momentum and a potential bottom may be in prospect. The next day's price action will confirm whether the bullish reversal is real or just another false bottom.
The dragonfly doji is rarely used by itself as a sole basis for trading decisions. Instead, it should be viewed in conjunction with other technical analysis tools and trends.
For example, if a security is in a clear downtrend and forms a dragonfly doji pattern at a support level, this could indicate a buying opportunity because the security has shown the ability to reverse a fall.
When a security is trending upward and a dragonfly doji appears near a resistance zone, it can hint at a possible topping pattern and a chance to go short, since the price has already demonstrated it can reverse after a run up.
What to Look for in a Dragonfly Doji
The candle's body is tiny or flat, reflecting a standoff between buyers and sellers. The open, high, and close sit at almost the same level, and because the open and close match, there's barely any real body even if some narrow trading occurred. A long lower shadow tells you buyers stepped in aggressively to counter heavy selling pressure, while the nearly missing upper wick signals that no meaningful bounce off the lows took hold.
That long lower shadow reveals how bears drove prices down early in the session but lost grip when buyers shoved prices back up. The absence of a real upper shadow underlines the hesitation and hints that bulls lacked the strength to push beyond the open.
The T-like shape itself speaks to indecision. The price didn't break to a fresh high or low in early trading. Instead, it hovered within a range dominated by sellers. A distinct gap between the high and low further reinforces that uncertainty.
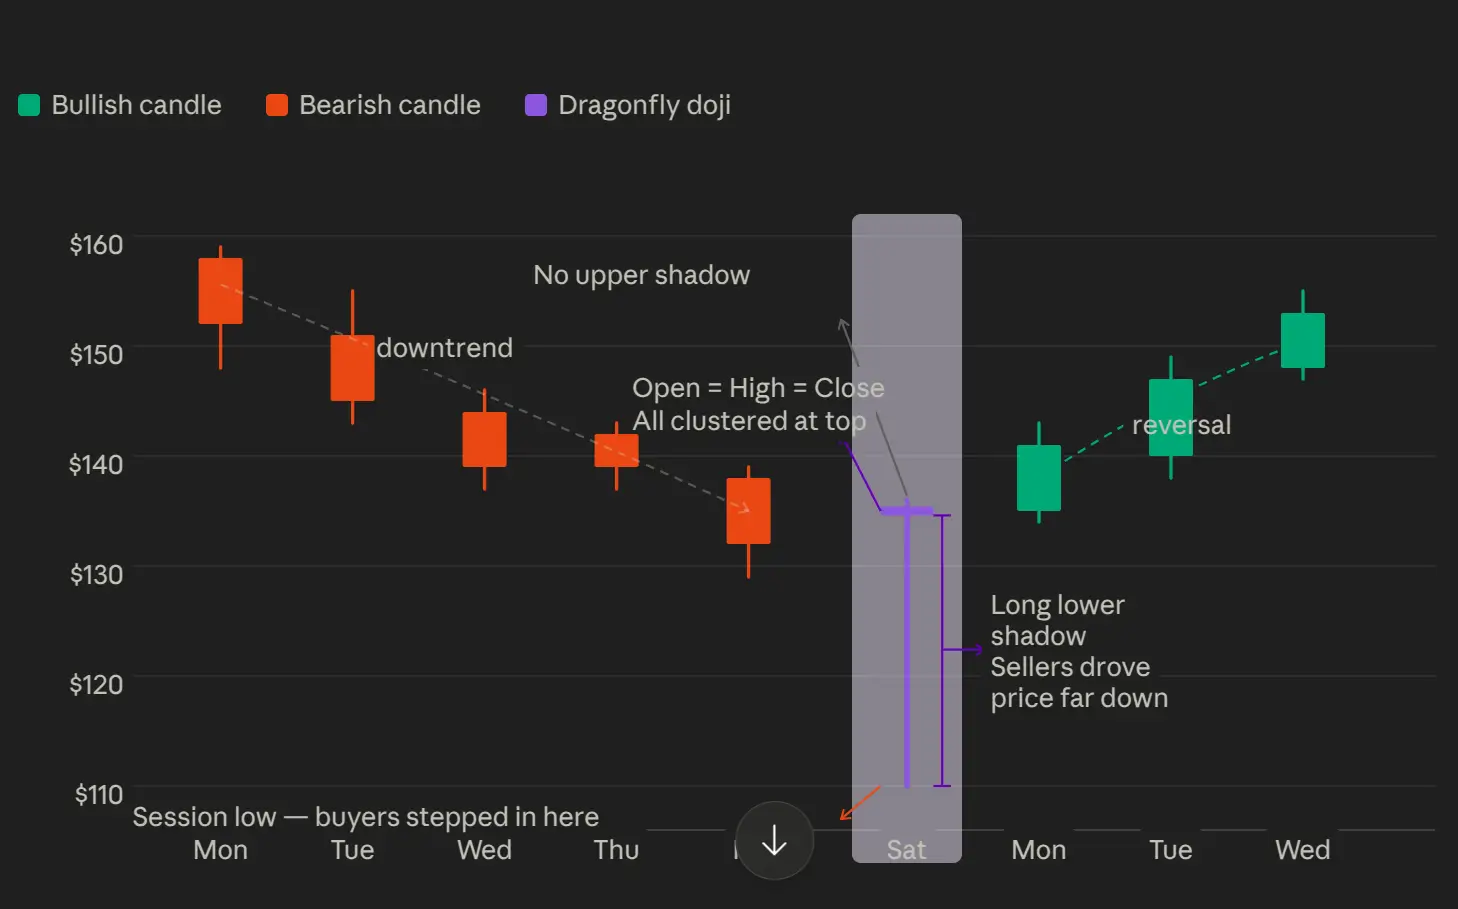
Dragonfly Doji characteristics on the chart
Dragonfly Doji vs Gravestone Doji Candlestick Pattern: Key Differences Explained
| Aspect | Dragonfly Doji | Gravestone Doji |
|---|---|---|
| Shape / Appearance | T-shaped (long lower shadow/wick, little to no upper shadow, open ≈ close near the high) | Inverted T-shaped (long upper shadow/wick, little to no lower shadow, open ≈ close near the low) |
| Market Context | Typically appears at the bottom of a downtrend | Typically appears at the top of an uptrend |
| Signal Type | Bullish reversal (buyers reject lower prices) | Bearish reversal (sellers reject higher prices) |
| Psychology | Sellers push price down aggressively but buyers step in strongly and push it back up | Buyers push price up aggressively but sellers take over and push it back down |
| Bullish or Bearish? | Primarily bullish (especially after downtrend) | Primarily bearish (especially after uptrend) |
| Confirmation Needed | Strong bullish candle + volume increase on next sessions | Strong bearish candle + volume increase on next sessions |
| Best Timeframe | Daily / 4H (stronger on higher timeframes) | Daily / 4H (stronger on higher timeframes) |
| Risk if Misinterpreted | Can fail in strong downtrends or ranging markets | Can fail in strong uptrends or low-volume conditions |
Dragonfly Doji Candlestick Pattern Example in Real Charts (Uptrend & Downtrend)
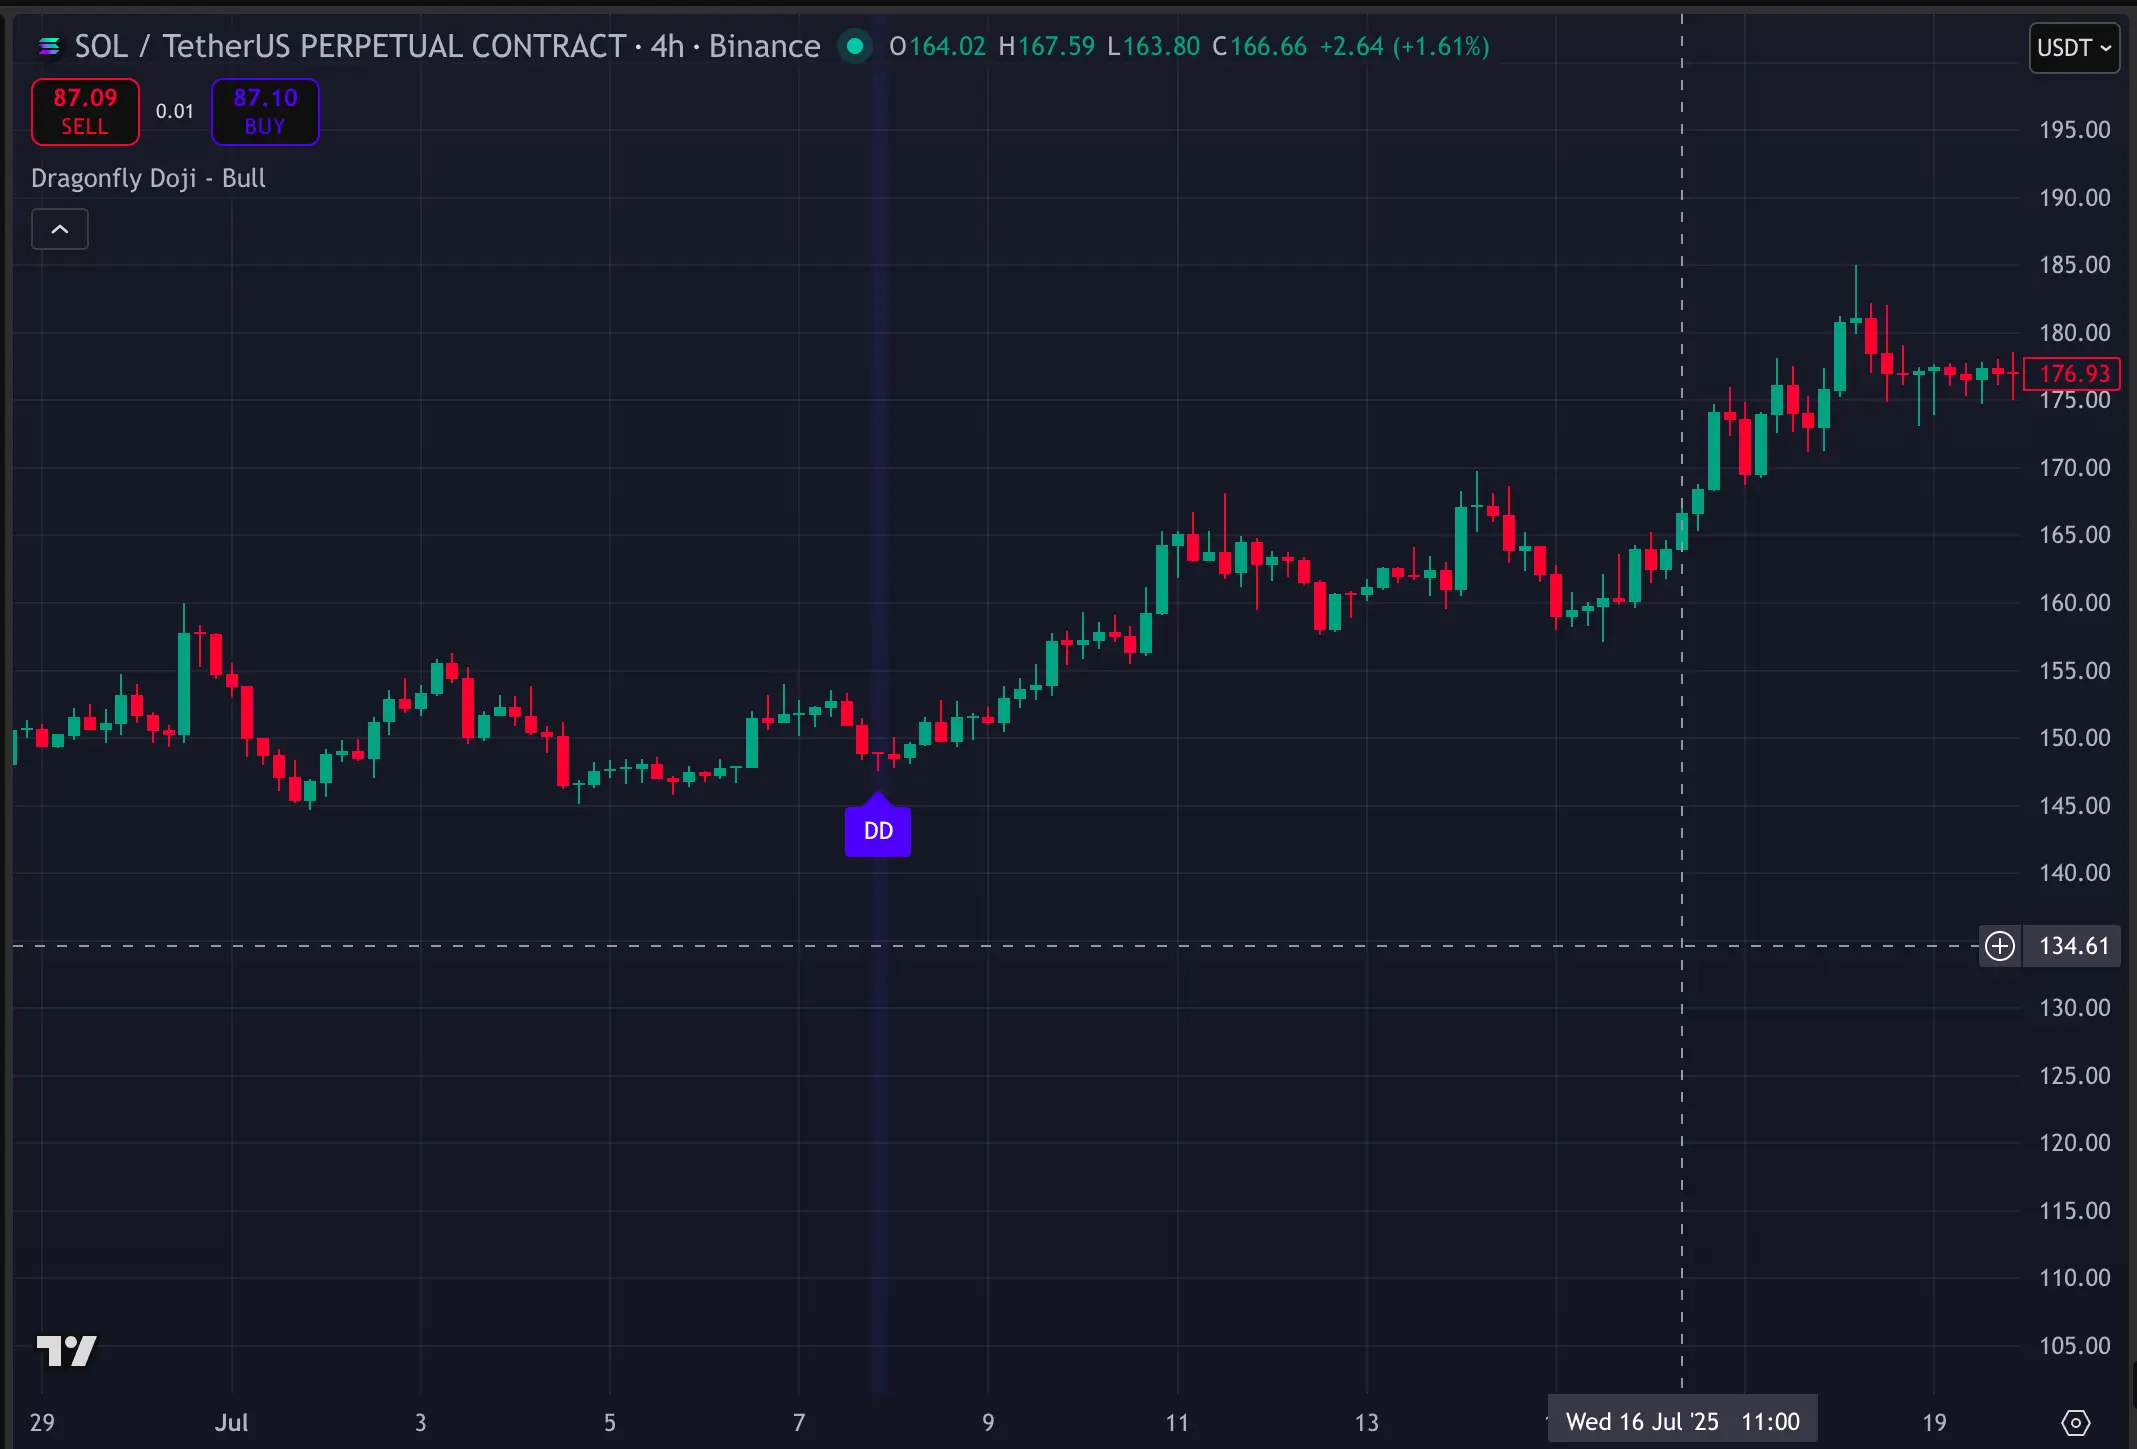
Here are 2 examples of bullish Dragonfly Doji pattern detected on XMR and Solana charts
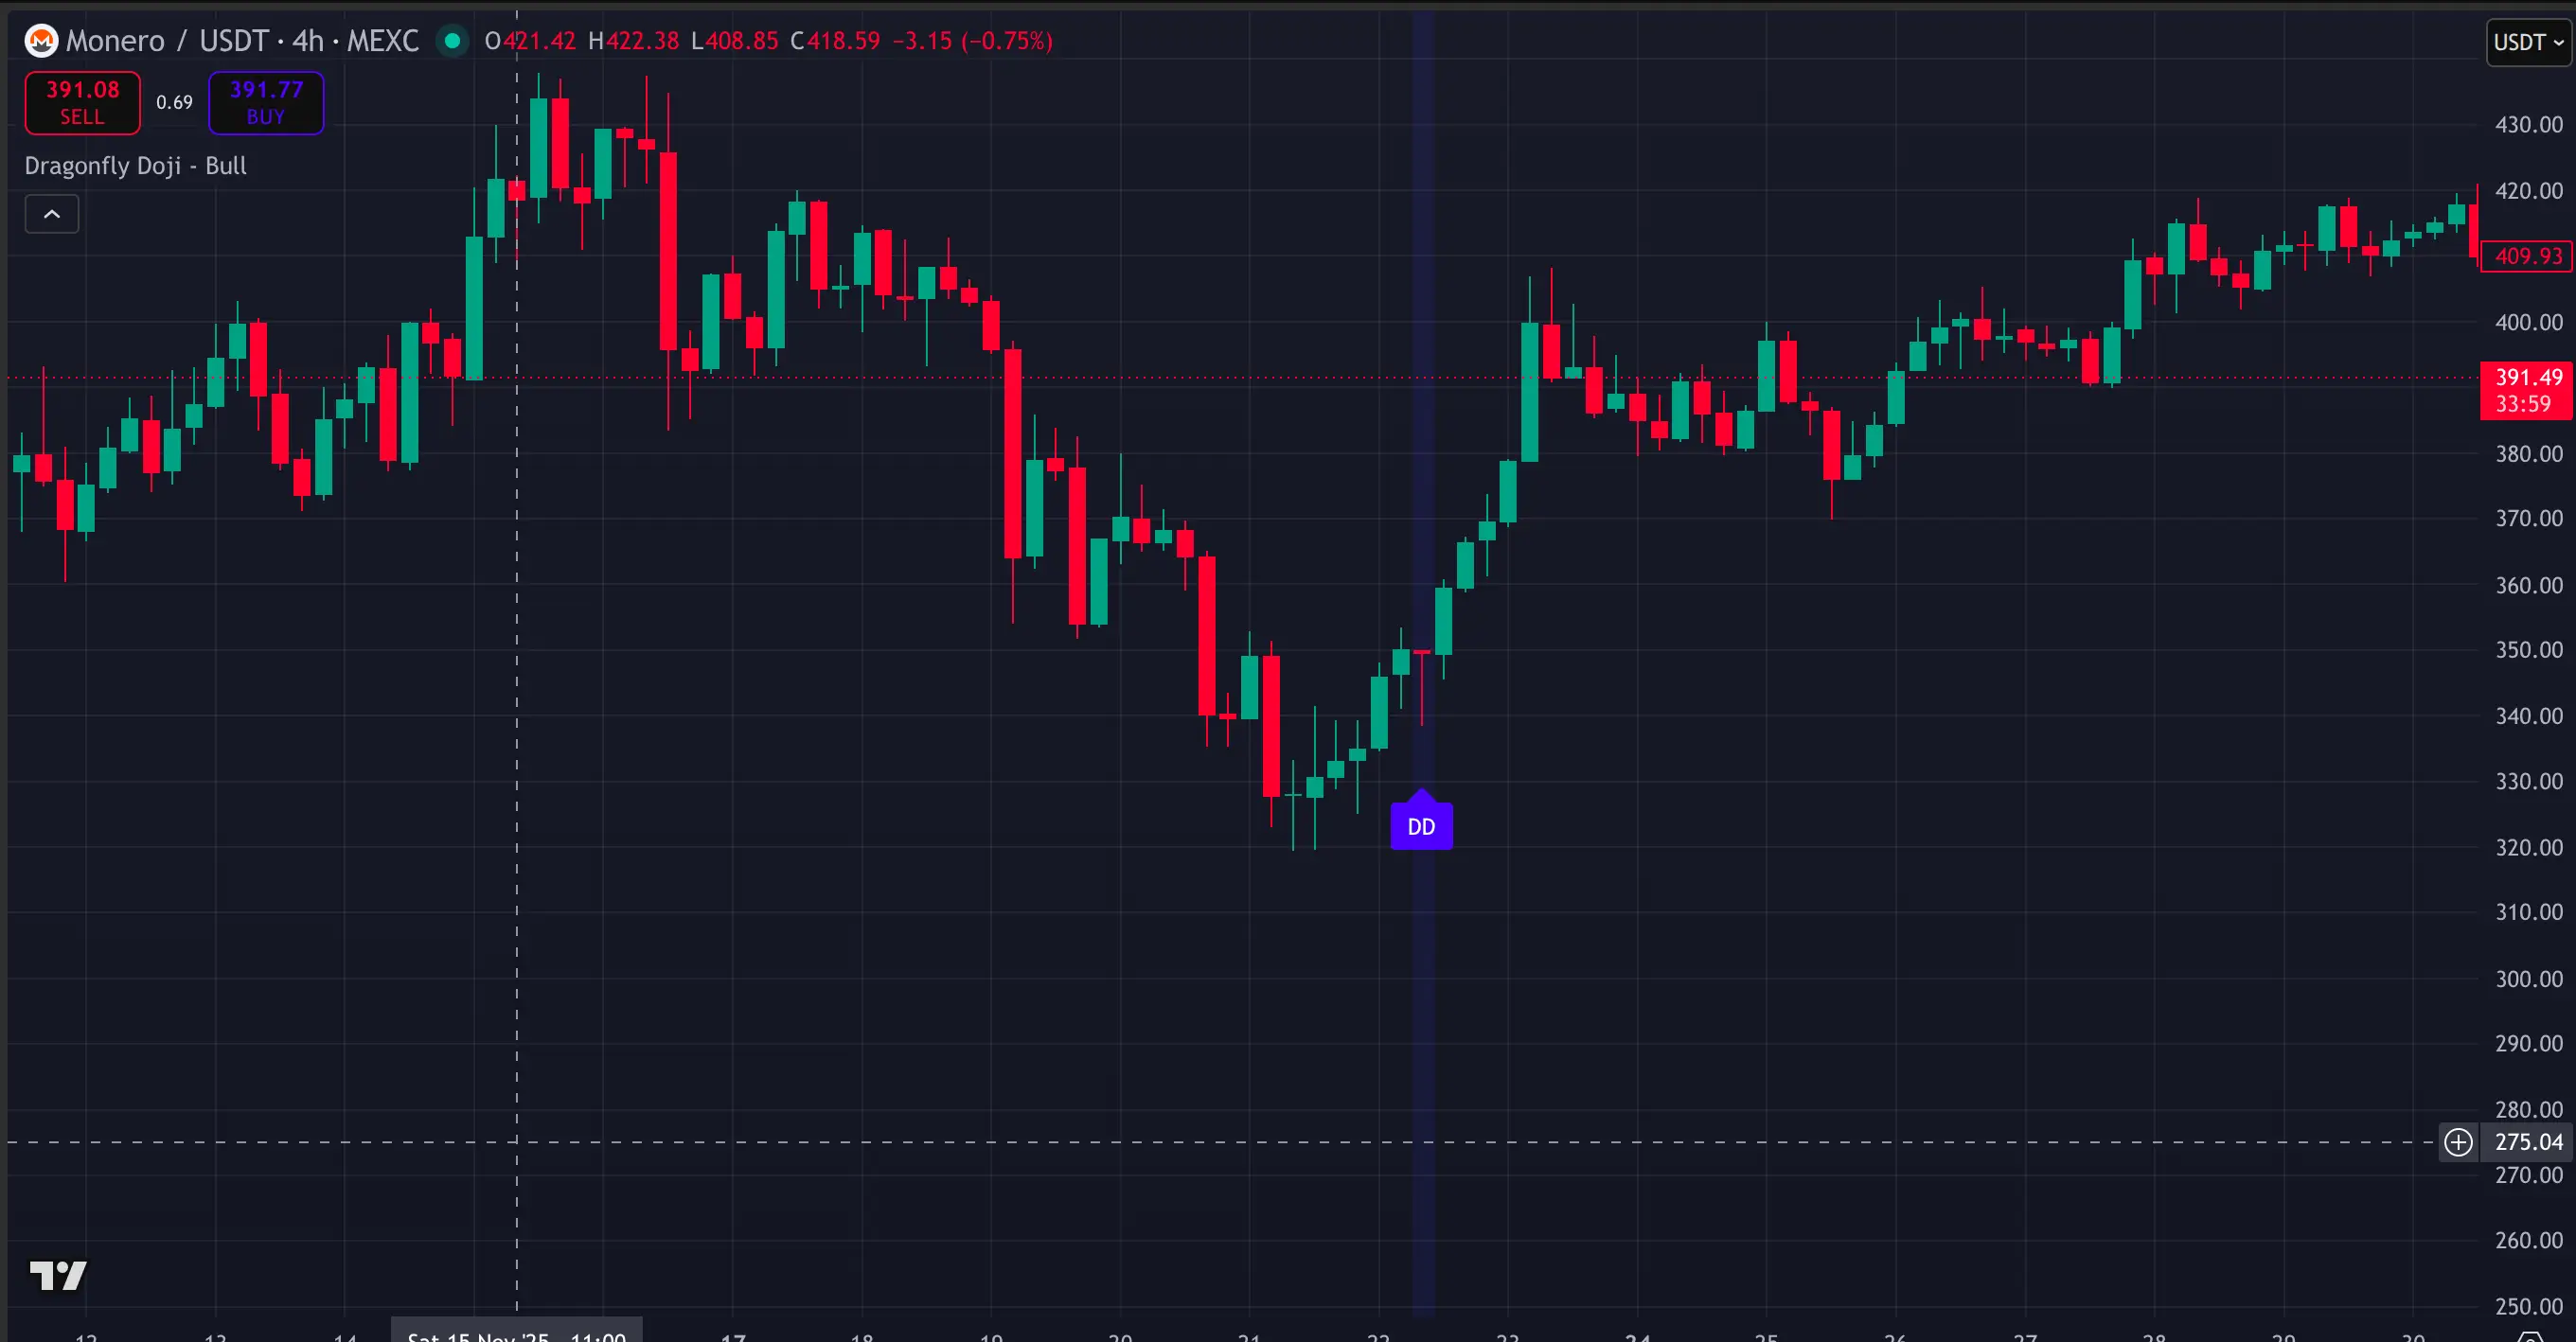
Bullish Dragonfly Doji Candlestick Pattern at the Bottom of a Downtrend
The market has been in a downtrend based on prior lower lows, but then a morning star pattern appeared that would confirm a trend reversal if completed. However, a bullish Dragonfly Doji pattern popped out without completion of the morning star — which is why a buy signal exists here.
A bullish Dragonfly Doji popped out at the bottom of the downtrend. This pattern includes a long lower shadow and virtually no upper shadow or wick. These patterns usually form during a strong downtrend and indicate that buyers pushed back after heavy selling pressure. The fact that the close was higher than the open proves that the bulls had enough momentum to reverse the bearish price action.
Volume came in strong after the first Doji.
How to Trade the Dragonfly Doji: Strategies, Confirmation & Risk Management
To trade a Dragonfly Doji, you must identify the pattern on a key support level where prices have trended in the opposite direction. Wait for a confirming candle on the next session before entering, place your stop loss below the low of the doji, and use Fibonacci extensions or nearby resistance as your profit target.
The key is to establish a base price level where a recent trend must be overcome by a larger one. This context makes the indecision represented by the Dragonfly Doji meaningful because a significant move in one direction or the other has first established a base of support.
Limitations When Trading Dragonfly Doji Patterns
The key to trading a dragonfly doji is to recognize that this pattern alone is unreliable. It requires subsequent price confirmation to be considered valid, and traders should implement strict risk management practices due to the inherent uncertainty.
Patience is essential when trading a dragonfly doji. Traders often get tempted to enter on the first pullback, but this rushy approach leads to premature entry and increased risk of taking a loss. The goal is to enter just before a significant price move, so being patient and waiting for a follow-through is crucial.
Traders should also avoid getting caught up in choppy markets because they invalidate trend lines and cause false signals. The pattern is best used in trending markets where the T‑shape provides clearer directional signals.
Common Mistakes When Trading a Dragonfly Doji
There are five main mistakes traders make when trying to trade a dragonfly doji:
- Trading too early — A dragonfly doji requires subsequent price confirmation to turn into a trend trade. Ignoring this fact often results in premature entry and increased risk of a loss. Traders should remain patient and wait for a follow-through by confirming the new trend on a subsequent pullback or push.
- Ignoring trend context — In a clear uptrend or downtrend, a dragonfly doji acts as a valid buy or sell signal. However, in a sideways market, the pattern becomes unreliable because the price breakout could just be a bounce or a dip. Always check for an underlying trend line before considering a dragonfly doji as the entry trigger.
- Overriding stop loss orders — Once you set your stop loss order, don’t override it. Stop loss orders are there to protect your capital and help prevent emotional trading. Repeatedly overriding stop loss orders or ignoring them completely defeats their purpose and can turn a profitable trade into an unprofitable one.
- Not using profit taking orders — While stop loss orders help control risk, profit taking orders can increase your profits. Use limit orders to lock in profits at predetermined levels to keep yourself from taking profits prematurely or staying in a position longer than you planned.
- Neglecting a trailing stop loss — Failing to use a trailing stop loss means leaving potential gains unprotected as the trade moves in your favor. A trailing stop automatically adjusts based on market movements to limit your risk while still allowing for the possibility of further price movement in your favor.
Getting emotionally attached to a trade can throw you off course. Trading is a process that involves setting stop loss and take profit orders, monitoring the trade, and exiting at the right time. Keeping emotions in check helps you stick to your plan and lowers the chance of impulsive decisions that can spiral into bigger losses.
Best Indicators to Combine with Dragonfly Doji for Higher Accuracy
When working with dragonfly dojis, pay close attention to volume. A strong buy signal appears when the price breaks out of a formation and then prints a candlestick pattern backed by solid up volume. This points to a sudden increase in buying pressure, which makes the reversal more dependable.
If the price makes a higher high after a down volume candlestick pattern emerges, that serves as a warning. The current trend might still be intact, undermining the validity of the initial reversal signal.
Using Moving Averages for Trend Confirmation
Another way to sharpen the accuracy of dragonfly dojis is by layering in moving averages. The 50 day MA helps spot shorter term trends, while the 200 day MA captures the broader picture, giving you a balanced sense of market direction. Together they help separate temporary pauses from genuine trend reversals.
Using Support and Resistance Levels for Entry Discipline
Support and resistance levels can also boost the reliability of dragonfly dojis. These key price zones act as battlegrounds where buyers at support or sellers at resistance show their strength. Pairing dragonfly dojis with support and resistance analysis lets traders better gauge trend momentum and place appropriate stop loss protection.
Using Fibonacci Retracements for Stop Loss Placement
Fibonacci retracement levels help traders set realistic stop loss orders. When a dragonfly doji forms inside a defined Fibonacci retracement zone, the subsequent countertrend move can test certain resistance levels before turning. Applying Fibonacci retracement allows you to place stop loss orders just below those resistance targets, offering precise protection.
Using Fibonacci Extensions for Profit Target Estimation
Fibonacci extensions work similarly for estimating potential profit targets after a dragonfly doji forms during a trending market. These extensions show where the price could push the opposite trend following a correction. Blending Fibonacci extensions with moving averages lets traders set realistic profit targets while maintaining adequate protection.
Personal experience: experimental trade leveraging dragonfly doji pattern
I spotted this pattern on CHZ crypto chart and opened a trade with 1/4 risk reward, you can see the results below:
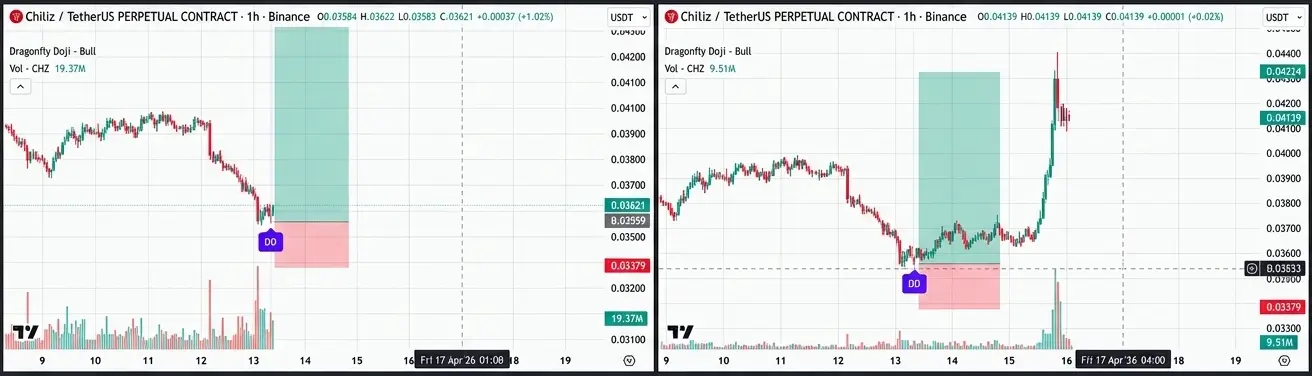
CHZ Long trade leveraging dragonfly doji candelstick pattern
Conclusion
The dragonfly doji catches your eye for a reason, but it won't do the heavy lifting on its own. Watch what happens next and let the surrounding price action confirm whether sellers actually lost control or if it was just a head fake. Combine it with volume, key levels, or a moving average so you're not trading the shape alone. More than anything, protect your account. A setup means nothing if you ignore your stop or skip your profit target. Trade the reaction, not just the pattern.
Frequently Asked Questions (FAQ)
Q: What is a Dragonfly Doji candlestick pattern?
A: The Dragonfly Doji is a candlestick pattern where the open and close prices are nearly identical (very small or flat body), with a long lower shadow and little to no upper shadow. It often signals a potential reversal, especially after a downtrend.
Q: Is the Dragonfly Doji bullish or bearish?
A: It is primarily considered a bullish reversal pattern. It typically appears at the bottom of a downtrend, showing that sellers pushed the price lower but buyers stepped in strongly to push it back up near the open.
Q: How do you identify a Dragonfly Doji?
A: Look for a candle with these features:
- Tiny or nonexistent body (open ≈ close)
- Long lower shadow/wick
- Little to no upper shadow
- It resembles a "T" shape
Q: What is the difference between Dragonfly Doji and Gravestone Doji?
A: The Dragonfly Doji has a long lower shadow and appears at the bottom of downtrends (bullish). The Gravestone Doji has a long upper shadow and appears at the top of uptrends (bearish).
Q: Can you trade using only the Dragonfly Doji pattern?
A: No. The Dragonfly Doji should not be used in isolation. It requires confirmation from the next candle, volume, overall trend, and support/resistance levels for higher reliability.
Q: Where does the Dragonfly Doji work best?
A: It performs best at key support levels during a downtrend. It is less reliable in choppy or sideways markets. Higher timeframes (Daily or 4H) tend to give stronger signals.
Q: What indicators should I combine with the Dragonfly Doji?
A: Volume, Moving Averages (50 & 200 MA), Support/Resistance levels, and Fibonacci retracements/extensions work well with it for better confirmation and risk management.
Q: What are the most common mistakes when trading the Dragonfly Doji?
A: Common mistakes include entering too early without confirmation, ignoring the overall trend, not using stop losses, failing to take profits, and trading in ranging/choppy markets.
Q: How do you set stop loss and take profit with a Dragonfly Doji?
A: Place stop loss below the low of the Dragonfly Doji candle or the nearest support. Use Fibonacci extensions or recent resistance levels to set profit targets.